There’s Something About Corsi

Photo: Chicago Tribune
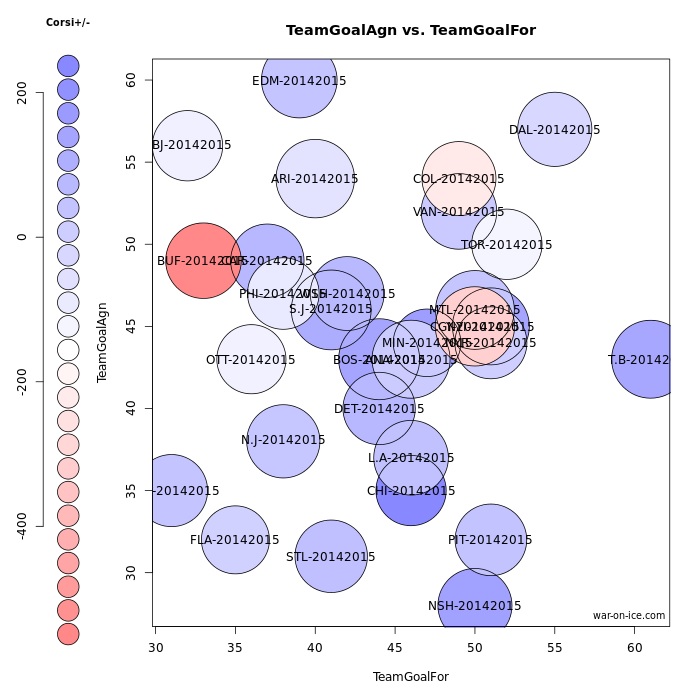
photo from war-on-ice.com
With offseason hirings of people like Cam Charron and Tyler Dellow, hockey is being dragged into advanced stats, in some cases, kicking and screaming. For better or worse, the “moneyball” era is here to stay, so I put together this hopefully easy to understand guide of the more common terms in the world of advanced stats, to prove that Corsi is nowhere near as scary as it looks.
Corsi/Fenwick
Corsi is probably the easiest “fancy stat” to get to grips with. Corsi is basically the number of shot attempts a player takes during a game. A Corsi event is a shot on goal, a shot that is blocked by a player, or a shot that misses the net. For example, last season, Jonathan Toews had 141 shots on goal in even strength play (5v5), and an individual Corsi of 206. Fenwick works exactly the same as Corsi, but doesn’t take blocked shots into account. Fenwick basically measures everything the goalie has to tense up for.
Then there’s Corsi for and Corsi against, which are the number of Corsi events taken while that player is on the ice both for his team and against it. (Toews had a Corsi for of 1238 last season, and a Corsi against of 851.) This number can then be turned into Corsi %. A Corsi % above 50% means that more shots attempts are taken while this player is on the ice for his team than are taken against his team. For example, Jonathan Toews’ Corsi % for last season was 59.26%. That means that he was on the ice for 9.26% more shots attempts for than against.
Corsi relative % is slightly more complicated. Corsi relative % takes the average team Corsi%, and works out how many more or less shots are taken when that player is on the ice, relative to the rest of the team. Last season, Jonathan Toews had a Corsi relative % of 5.5%. That means that he was on the ice for 5.5% more shot attempts for than the team average (55.28%).
Corsi and Fenwick are used to gauge possession numbers. Because it’s so hard to track possession in hockey the same way we would in soccer/football, for example, Corsi and Fenwick assume that teams who have possession for the majority of the game will be shooting the puck for the majority of the game, and therefore will be the better team. Last season, the top five teams for Corsi were LA, Chicago, New Jersey, Boston, and San Jose. Four of these five teams made the playoffs, two of them made it to the Conference finals, and one (Boston) won the President’s trophy. However, conversely, you have teams like Colorado, who finished in second place in the Western Conference and third in the entire NHL, and they had a Corsi of 47%, good for 26th in the league, just ahead of Montreal (another Conference final team).
Corsi teammate % is a very similar stat to Quality of Competition, which I’m not going to talk about here if only because Corsi teammate % is much more relevant (and easier to understand). Corsi teammate % measures how much higher the Corsi is of the players someone is on the ice for than the team average. For example, last season, Toews had a Corsi teammate % of 56.1%. This means that he played with players that had on average a Corsi 6.1% better than the average team Corsi. Andrew Shaw, who spent a lot of last season bouncing from line to line, had a Corsi teammate % of 56.6%, and Marcus Kruger, a season long fourth liner for the Blackhawks, had a Corsi teammate % of 48.8%, so he played with players who had on average a Corsi 1.2% worse than the team average. This is likely due to Brandon Bollig‘s less than stellar possession numbers last season, as the Blackhawks are collectively generally a very good possession team.
PDO
PDO is a weird stat. In layman’s terms, it basically calculates how lucky or unlucky a team is. PDO is a number that generally hovers above or below 100, and it’s a team’s shooting percentage plus that team’s save percentage (for example, last season, the Chicago Blackhawks had a shooting percentage of 8.4%, and a save percentage of 91.47. This gave them a PDO of 99.87. This is about average. In 2013, the year they won the Cup, they had a PDO of 102.03. This meant that they had both absurdly high shooting and save percentages, which is a huge reason for their success. Generally though, this number would be unsustainable, but it’s a good way of tracking how teams are playing, and whether they’re going on a hot streak or going through a slump. Teams will not generally have a PDO of higher than 101 or lower than 99 for longer than a season unless they’re an unusually good team (Chicago, LA) or an unusually bad team (Buffalo, Edmonton).
On Ice Shooting Percentage
On ice shooting percentage is a way of calculating what kind of effect a player has on a team’s performance. On ice shooting % is what percentage of shots are scored on while that player is on the ice. It’s kind of like plus/minus
Last season, Toews had an on ice shooting percentage of 9.17%. This means he was on the ice for 9.71% of the 182 goals Chicago scored that season. When you compare this to Michal Rozsival, who has a slightly higher average TOI, but only has an on ice shooting % of 8.1%, you can see that of the two skaters, you want to get Toews out on the ice much more often than Rozsival, because more goals happen while he’s on the ice than while Rozsival is. A lot of this can come down to who regularly shares the ice with a player. Toews’ regular linemates, Patrick Sharp and Marian Hossa, are both excellent players in their own right, so he’s going to be on the ice for a lot of those goals, as well as goals by defencemen (Chicago’s best defencemen are Duncan Keith and Brent Seabrook, both excellent offensively as well as defensively).
Offensive/Defensive Zone Starts
Another factor in scoring is where the faceoff is taken when a player is on the ice. Obviously, it’s easier to score if you have a faceoff in your offensive zone. Equally, it’s harder to score if the faceoff is in your defensive zone. Looking at zone start time should be a really easy indicator of what a player’s main role is. If your player is relied on for scoring (for example, the Sharp-Toews-Hossa line in Chicago, or any time Patrick Kane is on the ice) then chances are they will get most of their faceoffs in the offensive zone. If a player is relied on for possession, then they will get the majority of their faceoffs in the defensive zone (for example, last season’s fourth line of Bollig-Kruger-Smith). A line like this season’s Bickell-Shaw-Carcillo line, which is relied on for checking, will likely get many of it’s starts in the neutral zone.
Last season, Jonathan Toews had 63.62% of his zone starts in the offensive zone. Patrick Kane had 69.61% of his starts in the offensive zone. This is because Toews is a much more reliable two way player, with a higher defensive responsibility, and can be trusted at both ends of the ice. Kane is much more of a purely offensive player, and as such takes very few shifts in the defensive zone, outside of icings. Ben Smith has only 26.16% of his starts in the offensive zone, this is because he is almost exclusively a possession player (shown by the amount of time he is given on the penalty kill) and is rarely relied on to score.
These certainly aren’t all the possible stats out there, they’re just a few of the easier to understand and more relevant ones. war-on-ice.com is an excellent website, with up to date stats for games as they happen, with a ton of easy to understand graphs and charts to help you get to grips with advanced stats.